or predicted values.
 Point estimates of the mean response for the given values of the predictors,
factor levels, or components. Fitted values are also called or predicted values.
In regression analysis, fitted values are essential to determining whether your model fits the data. You calculate them by entering selected x-values into the regression equation. For example, if the equation is y = 5 + 10x, the fitted value for the x-value, 2, is 25 (25 = 5 + 10(2)).
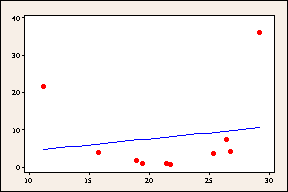
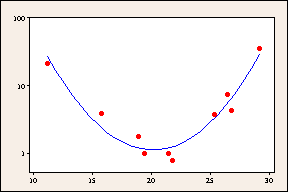
Fitted line plots graphically represent the fitted values for all x-values in the region of interest. These plots are a convenient way to compare fitted values to actual data values in order to assess model fit. Below, the fitted line plots for two different models are compared to see which model fits the data better.
X-values represent the setting of a factory machine and the y-values are the resulting energy consumption of those machines.
|
Energy |
|
|
|
|
Machine Setting |
|
A visual inspection of the linear model on the left reveals that the line does not fit the data. The log transformed quadratic model on the right appears to provide a good fit to the data.
Free online chart generators for statistical analysis:
Useful tools: