weight
height
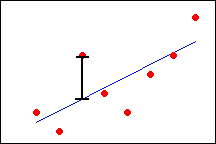
The difference between an observed value (y) and its corresponding fitted value (ŷ). For example, the scatterplot below plots men's weight against their height; the regression line plots the fitted values of weight for each observed value of height. Suppose a man is 6 feet tall and the fitted value of his weight is 190 lbs. If his actual weight is 200, the residual is 10. If his actual weight is 175, the residual is -15.
|
weight |
|
|
|
height |
Residual values are especially useful in regression and ANOVA procedures because they indicate the extent to which a model accounts for the variation in the observed data.
Free online chart generators for statistical analysis:
Useful tools: