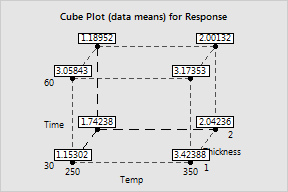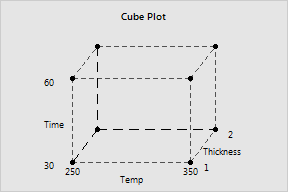
Use a cube plot to see the factors and combination of settings used
in your design. In the example below, you can see the low and high settings
for Time (30 minutes and 60 minutes), Temp (250
Optionally, you can add a mean response at each setting.