Corner point
Center point
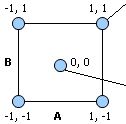
Include corner points (or cube points) and center points. Points on the diagram below represent combinations of factor levels in a two-factor design.
|
|
Corner point
Center point
|
True center points can only be used with numeric factors set at the midpoint between the two chosen levels. If you have a combination of categorical and numeric factors, Minitab creates pseudo-center points. These points are the center points for numerical factors at each combination of the levels of the categorical factors.
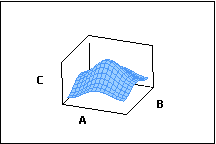
Adding center points to a design checks for curvature in the response surface. If curvature exists, the response at the center point is either higher or lower than the average response at the factorial (corner) points. Curvature is usually present when factor settings are near an maximum or minimum response value.
|
|
Example of curvature. |
You can also use center points to estimate variability without having to replicate all corner points.
Free online chart generators for statistical analysis:
Useful tools: