main topic interpreting results session command see also
Suppose you want to investigate the deterioration of an insulation used for electric motors. You want to know if you can predict failure times for the insulation based on the plant in which it was manufactured, and the temperature at which the motor runs. It is known that an Arrhenius relationship exists between temperature and loge failure time.
You gather failure times at plant 1 and plant 2 for the insulation at
four temperatures - 110, 130, 150, and 170
To see how well the model fits, you will draw a probability plot based on the standardized residuals.
1 Open the worksheet INSULATE.MTW.
2 Choose Stat > Reliability/Survival > Regression with Life Data.
3 In Variables/Start variables, enter FailureT.
4 In Model, enter ArrTemp Plant. In Factors (optional), enter Plant.
5 Click Censor. In Use censoring columns, enter Censor, then click OK.
6 Click Estimate. In Enter new predictor values, enter ArrNewT NewPlant, then click OK.
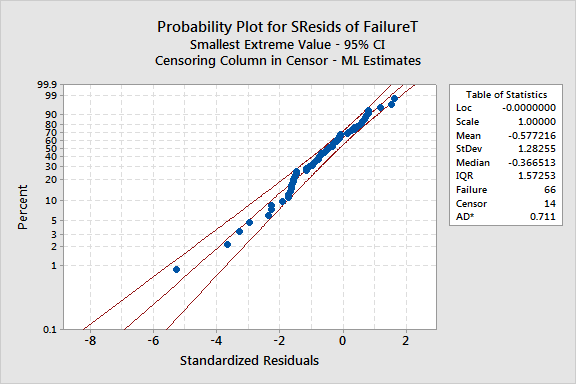
7 Click Graphs. Check Probability plot for standardized residuals, then click OK in each dialog box.
Session window output
Regression with Life Data: FailureT versus ArrTemp, Plant
Response Variable: FailureT
Censoring Information Count Uncensored value 66 Right censored value 14
Censoring value: Censor = C
Estimation Method: Maximum Likelihood
Distribution: Weibull
Relationship with accelerating variable(s): Linear
Regression Table
Standard 95.0% Normal CI Predictor Coef Error Z P Lower Upper Intercept -15.3411 0.950822 -16.13 0.000 -17.2047 -13.4775 ArrTemp 0.839255 0.0339710 24.71 0.000 0.772673 0.905837 Plant 2 -0.180767 0.0845721 -2.14 0.033 -0.346525 -0.0150083 Shape 2.94309 0.270658 2.45768 3.52439
Log-Likelihood = -562.525
Table of Percentiles
Standard 95.0% Normal CI Percent ArrTemp Plant Percentile Error Lower Upper 50 32.8600 1 182094 32466.2 128390 258261 50 32.8600 2 151981 25286.6 109690 210578 50 31.0988 1 41530.4 5163.76 32548.4 52990.9 50 31.0988 2 34662.5 3913.87 27781.0 43248.6 |
Graph window output:
From the Regression Table, you get the coefficients for the regression model. For the Weibull distribution, here is the equation that describes the relationship between temperature and failure time for the insulation for plant 1 and 2, respectively:
Loge (failure time)
= -15.3411 + 0.83925
(ArrTemp) + 1/2.9431![]()
Loge (failure time)
= -15.52187 + 0.83925
(ArrTemp) + 1/2.9431![]()
where ![]() = the pth percentile of the error
distribution
= the pth percentile of the error
distribution
ArrTemp = 11604.83/(Temp + 273.16)
The Table of Percentiles displays the 50th percentiles for the combinations of temperatures and plants that you entered. The 50th percentile is a good estimate of how long the insulation will last in the field:
As you can see from the low p-values, the plants are significantly different at the a = .05 level, and temperature is a significant predictor.
The probability plot for standardized residuals will help you determine whether the distribution, transformation, and equal shape (Weibull or exponential) or scale parameter (other distributions) assumption is appropriate. Here, the plot points fit the fitted line adequately; therefore you can assume the model is appropriate.