 Example of orthogonal regression
main topic interpreting results session command see also
Example of orthogonal regressionA medical equipment company wants to determine if their new blood pressure monitor is equivalent to a similar model on the market. They obtain systolic blood pressure readings on a random sample of 60 people using the two instruments. Based on a previously conducted study, the company knows that the error variance ratio is 0.90.
1 Open the worksheet BLOODPRESSURE.MTW.
2 Choose Stat > Regression > Orthogonal Regression.
3 In Response (Y), enter New.
4 In Predictor (X), enter Current.
5 In Error variance ratio (Y/X), enter 0.90.
6 Click OK.
Session window output
Orthogonal Regression Analysis: New versus Current
Error Variance Ratio (New/Current): 0.9
Regression Equation New = 0.644 + 0.995 Current
Coefficients
Predictor Coef SE Coef Z P Approx 95% CI Constant 0.64441 1.74470 0.3694 0.712 (-2.77513, 4.06395) Current 0.99542 0.01415 70.3461 0.000 ( 0.96769, 1.02315)
Error Variances
Variable Variance New 1.07856 Current 1.19840 |
Graph window output
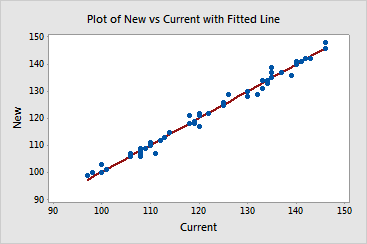
0 is contained in the confidence interval for the intercept (-2.77513, 4.06395) and 1 is contained in the confidence interval for the slope (0.96769, 1.02315). Therefore, no evidence exists that the two instruments measure different things.
Free online chart generators for statistical analysis:
Useful tools: