A fundamental theorem of probability and statistics, it states that
the distribution of  , the mean of a random sample from
a population with finite variance, is approximately normally distributed
when the sample size is large, regardless of the shape of the population's
distribution. Many common statistical procedures require data to be approximately
normal, but the central limit theorem enables you to apply these useful
procedures to populations that are strongly nonnormal. How large the sample
size must be depends on the shape of the original distribution. If the
population's distribution is symmetric, a sample size of 5 may yield a
good approximation; if the population's distribution is strongly asymmetric,
a larger sample size
, the mean of a random sample from
a population with finite variance, is approximately normally distributed
when the sample size is large, regardless of the shape of the population's
distribution. Many common statistical procedures require data to be approximately
normal, but the central limit theorem enables you to apply these useful
procedures to populations that are strongly nonnormal. How large the sample
size must be depends on the shape of the original distribution. If the
population's distribution is symmetric, a sample size of 5 may yield a
good approximation; if the population's distribution is strongly asymmetric,
a larger sample size
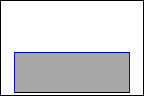
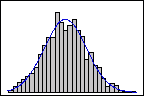
For example, consider a population that follows a uniform distribution. The uniform probability distribution plot on the left indicates that the population is symmetric but strongly nonnormal. However, the distribution of sample means (n=5) from this population is approximately normal because of the central limit theorem, as the second histogram demonstrates. This histogram of sample means includes a superimposed normal curve to illustrate its normality.
|
Distribution of a uniform population |
|
Distribution of 1000 sample means (n=5) from a uniform population |
|
|
|
|
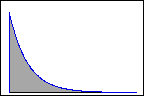
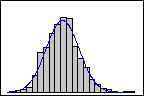
The following graphs illustrate the central limit theorem with a population that follows an exponential distribution. This population is asymmetric and nonnormal, as the probability distribution plot on the left demonstrates. However, the distribution of sample means from 1000 samples of size 50 from this population is approximately normal because of the central limit theorem, as the second histogram demonstrates. This histogram of sample means includes a superimposed normal curve to illustrate its normality.
|
Distribution of an exponential population |
|
Distribution of 1000 sample means (n=50) from an exponential population |
|
|
|
|
Free online chart generators for statistical analysis:
Useful tools: