Mean cumulative function and Nelson-Aalen plot
The mean cumulative function is the average cumulative number of failures
or cost over all systems in the time interval (0, t). This function is
overlaid on the Nelson-Aalen plot to help you determine how the number
of failures or your repair costs are changing over time. In other words,
it describes your system as improving, deteriorating, or staying constant.
The overlaid plot consists of:
· The
Nelson-Aalen plot, which is a plot of the empirical mean cumulative function.
The plot points do not assume a particular model. When you have interval
data, Minitab estimates failure times by evenly distributing the number
of occurrences in each interval and plotting the appropriate points.
· The
mean cumulative function curve, which is a plot of the mean cumulative
function based on the estimated shape and scale. The function appears
as a straight line or a curve. For a power-law process, the rate of system
failures can increase, decrease, or remain constant. For a homogeneous
Poisson process, the failure rate is constant, resulting in a straight
line.
Because the Nelson-Aalen plot does not depend on the model, the plot
points are the same regardless of which estimation method and model type
you chose. The mean cumulative function plot, however, differs depending
on your model.
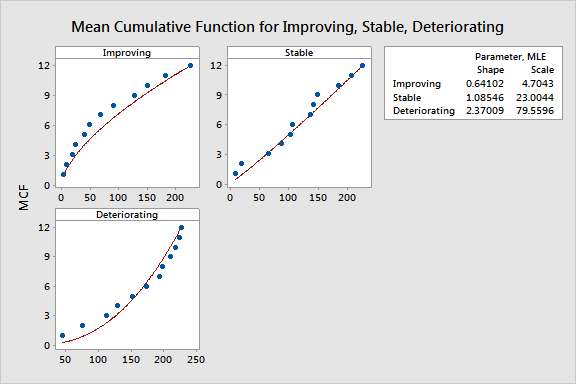
The plot provides information about the pattern of system failures:
· A
straight line pattern indicates that system failures are remaining constant
over time - your system is stable
· A
convex (curving down) pattern indicates that the time between failures
is increasing over time - your system reliability is improving
· A
concave (curving up) pattern indicates that the time between failures
is decreasing over time - your system reliability is deteriorating
Below are examples of mean cumulative function and Nelson-Aalen plots
for improving, stable, and deteriorating systems.