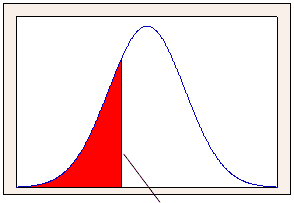
Divide the data set into parts. In general, the nth percentile has n% of the observations below it, and (100-n)% of observations above it.
|
|
Of the total data values, 25% lie below the 25th percentile (red region), while 75% lie above the 25th percentile (white region). |
|
25th percentile |
|
The 50th percentile represents the median of the data (half the observations fall above it and half fall below it). In normal capability analysis, the distance between the 99.87th and 0.13th percentiles is equivalent to 6 standard deviations.
In Minitab, you can use the Calculator to find a given percentile for a column of numbers, or use Reliability/Survival to estimate percentiles based on a distribution and your sample data. For example, you can estimate the time at which a certain percent of the population has failed. In the table below, the 1st percentile, or the time at which 1% of the windings have failed, is 10 months.
|
Table of Percentiles |
||||
|
|
|
Standard |
95.0% Normal CI |
|
|
Percent |
Percentile |
Error |
Lower |
Upper |
|
1 |
10.0765 |
2.7845 |
5.8626 |
17.3193 |
|
2 |
13.6193 |
3.2316 |
8.5543 |
21.6834 |
|
3 |
16.2590 |
3.4890 |
10.6767 |
24.7601 |
|
4 |
18.4489 |
3.6635 |
12.5009 |
27.2270 |
Free online chart generators for statistical analysis:
Useful tools: