
Cube Plot
Factorial Designs


|
|
Cube PlotFactorial Designs |
|
Cube plots can be used to show the relationship between factors and a response. Each cube can show three factors. If there are only two factors, Minitab displays a square plot. Minitab draws as many cubes as necessary to show up to eight factors. You can draw a cube plot for two types of means:
|
Note |
You can create a cube plot with or without a response measure. Viewing the factors without the response allows you to see what a design looks like. |
Example Output |
|
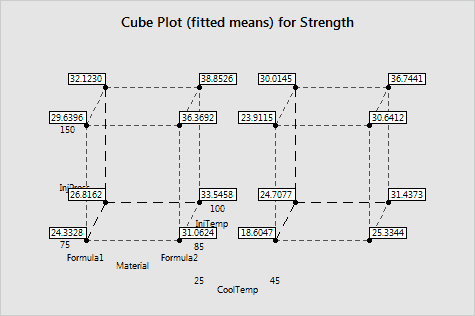
Interpretation |
|
For the insulation data, two cubes are used to represent the four factors. The cube on the left shows the response means when cooling temperature = 25. The cube on the right shows the response means when cooling temperature = 45. Use the fitted means on the cube plot to see the model predictions at all of the points in the design.
Free online chart generators for statistical analysis:
Useful tools:

