
Overlaid Contour Plot
Response Surface Designs
Graphs - Overlaid Contour Plot


|
|
Overlaid Contour Plot
|
|
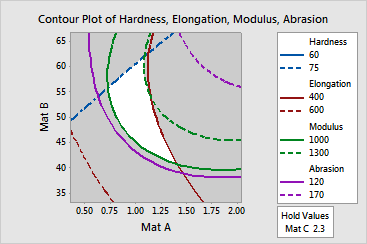
Look at the overlaid contour plot and find the white area, which is the feasible region. The feasible region is the area formed by the two factors, given the hold values of any other factors, such that the acceptable values for each response are between their respective contours.
Because only a pair of factors can be displayed on each overlaid contour plot, and any additional factors are held at a fixed level, a single contour plot may not provide a complete picture of the feasible region. You might consider creating overlaid contour plots for all possible pairs of factors, and changing the hold values of the additional factors.
Overlaid contour plot does not use the data in the worksheet. Instead, Minitab estimates the contours based on stored models. If you want to include multiple responses, you must fit a model for each response separately. Overlaid contour plots are accurate only if all models represent the true relationships.
Example Output |
|
Interpretation |
|
For the tire tread data, the white area is the region formed by Material A and Material B, given Material C is 2.3, such that the acceptable values for the four responses are between their respective contours. Any factor settings for Mat A and Mat B that fall in this region should produce a product with acceptable responses. For example, possible combinations of factor settings include:
Free online chart generators for statistical analysis:
Useful tools:

