
Analyze Taguchi Design
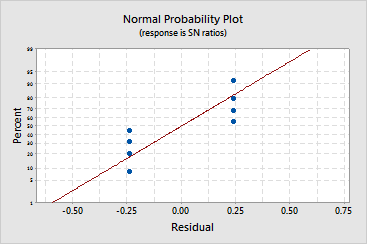
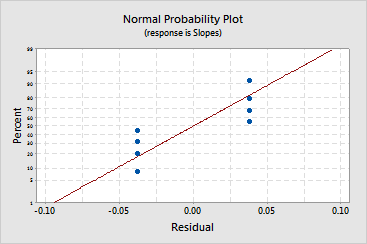
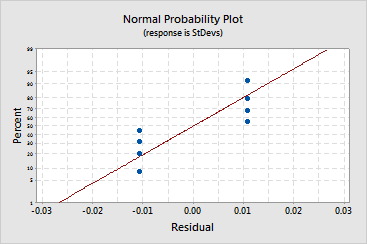
Graphs - Normal Plot of the Residuals
![]()
![]()
![]()
|
|
Analyze Taguchi DesignGraphs - Normal Plot of the Residuals |
|
This graph plots the residuals versus their expected values when the distribution is normal. The residuals from the analysis should be normally distributed. In practice, for balanced or nearly balanced designs or for data with a large number of observations, moderate departures from normality do not seriously affect the results.
The normal probability plot of the residuals should roughly follow a straight line. Use this plot to look for the following:
|
This pattern... |
Indicates... |
|
Not a straight line |
|
|
Curve in the tails |
|
|
A point far away from the line |
An outlier |
|
Changing slope |
Example Output |
|
Interpretation |
|
For the basil data, the residuals do not appear to follow a straight line. It is uncertain whether or not there is evidence of nonnormality, skewness, outliers, or unidentified variables because there are so few observations.