Minimax: surface and contour plots
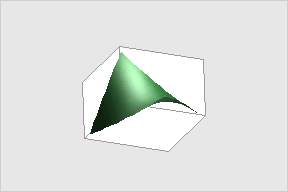
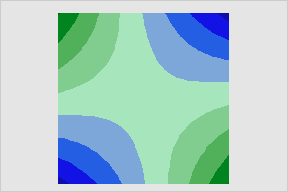
The following surface and contour plots represent a minimax response surface. As the color gets darker, the response increases. Note the relationship between the shape of the surface and the shape of the contours. From the stationary point (saddle point) near the center of the design, simultaneously increasing or decreasing both factors leads to a decrease in the response. But from the stationary point (saddle point), increasing either factor while decreasing the other leads to an increase in the response. Both the surface and contour plots are based on a regression model.
|
Minimax surface plot |
Minimax contour plot |
|
|
|
Free online chart generators for statistical analysis:
Useful tools: