
Acceptance Sampling by Variables - Create
Graphs - Average Outgoing Quality (AOQ) Curve


|
|
Acceptance Sampling by Variables - CreateGraphs - Average Outgoing Quality (AOQ) Curve |
|
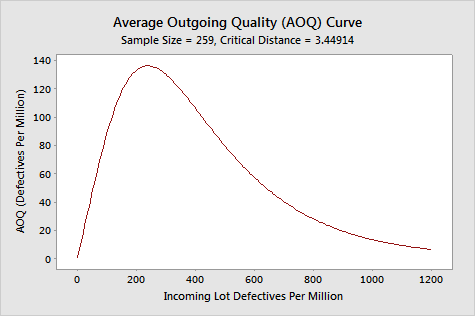
This plot allows you to see the average outgoing quality level at various incoming quality levels.
Example Output |
|
Interpretation |
|
For the camera lenses, when the average incoming quality level is 100 defectives per million, the average outgoing quality appears close to 90 defectives per million. When the average incoming quality level is 600 defectives per million, the average outgoing quality appears close to 57defectives per million.
The worst outgoing quality level, the average outgoing quality limit (AOQL), appears to be when the incoming quality level of the lenses is approximately just over 200 defectives per million.
Free online chart generators for statistical analysis:
Useful tools:

