
Attribute Gage Study
(Analytic Method)
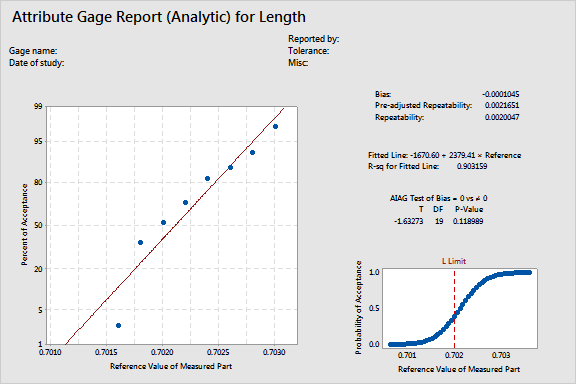
Graphs - Gage Performance Curve
![]()
![]()
![]()
|
|
Attribute Gage Study
|
|
Like the normal probability plot, the gage performance curve shows the probability of acceptance for each reference value. The lower tolerance limit (L Limit) indicates the probability of acceptance at this limit.
When a gage has an upper limit, the actual probabilities of acceptance for the larger reference values will decrease at some point. When an attribute gage has a lower and upper limit, the gage performance curves are mirror images.
Example Output |
|
Interpretation |
|
For the length data, you have approximately a 0.5 probability of acceptance at the lower tolerance level of 0.702.