
Capability Sixpack - Nonnormal
Graphs - Xbar and R Chart


|
|
Capability Sixpack - NonnormalGraphs - Xbar and R Chart |
|
The Xbar and R Chart is located in the upper left corner of the Capability Sixpack - Nonnormal.
Use the Xbar-R chart or the I-MR chart to assess whether the process is in control. The process should be in control before you begin to assess capability. If the process is not in control then the process capability indices will be inaccurate.
Because the process data do not follow a normal distribution, the subgroup size should not be too small (>5, say) so that the estimates of the control limits will be close to the true values.
Which chart is displayed depends on the subgroup size:
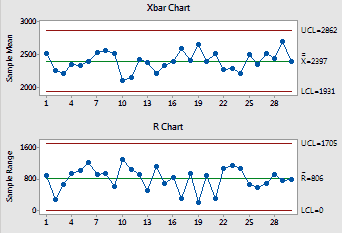
- The Xbar chart plots the subgroup means. Use the Xbar chart to determine whether the average subgroup measurements are in control.
- The R chart plots the subgroup ranges. Use the R chart to determine whether the subgroup-to-subgroup variation is in control.
- The S chart plots the subgroup standard deviation. Use the S chart to determine whether the subgroup-to-subgroup variation is in control.
- The I chart plots the individual observations. Use the I chart to assess whether the individual measurements are in control.
- The MR chart plots moving ranges for consecutive observations. Use the MR chart to assess whether the variation from observation to observation is in control.
Examine the Xbar-R chart or I-MR chart for points located beyond the red control limits. Points located beyond the control limits signal that the process is out-of-control. Capability analyses should only be conducted when the process is in control.
Example Output |
|
Interpretation |
|
For the electronic device data, the subgroup size is 5, so an Xbar-R chart is displayed. No points are located beyond the control limits, therefore the process is in control and further capability analyses can be conducted.
Free online chart generators for statistical analysis:
Useful tools:

