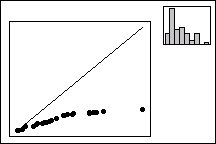
Skewness to the right
Here, the points diverge below the line, indicating skewness to the right. The distribution stretches out further to the right than the left. This pattern is common when you have non-negative data (counts, measurements).
|
|
Symmetry Plot |
|
Lower Distance to Median |
Upper distance to Median |
Free online chart generators for statistical analysis:
Useful tools: