
What is a variables chart for individuals
Variables control charts for individuals are powerful and simple visual
tools for determining whether a process is in or out of control.
· An
in-control
process exhibits only random variation within the control limits.
· An
out-of-control
process demonstrates unusual variation due to the presence of special causes.
In other words, control charts can help you determine whether the process average
(center) and process variability
(spread) are operating at constant levels. Control charts help you focus
problem-solving efforts by distinguishing between common and special-cause
variation.
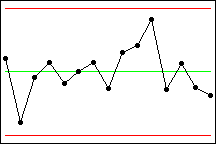
A variables control chart for individuals consists of:
· Plotted points, each of which represents
an individual observation sampled from the process. Minitab plots this
value versus a sample number or time, and displays the results in time
order.
· A center line, which represents the
expected value of the quality characteristics for all observations.
· Upper and lower control limits (UCL
and LCL), which are set at a distance of 3 s
above and below the center line. These control limits provide a visual
display for the expected amount of variation.
Control limits predict how the process should behave. The control limits
are based on the actual behavior of the process, not the desired behavior
- they are not specification limits.
A process can be in control and yet not be capable of meeting requirements.
Control charts evaluate the pattern of variation for stability through
the use of tests for special causes.
If you detect special cause variation, you should seek out the factors
that contribute to this variation so that you can implement corrective
measures.