What is a time-weighted control chart?
Time-weighted control charts are powerful and simple visual tools for determining whether a process is in or out of control.
In other words, control charts can help you determine whether the process average (center) and process variability (spread) are operating at constant levels. Control charts help you focus problem-solving efforts by distinguishing between common and special-cause variation.
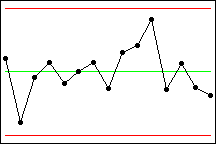
Time-weighted control charts are a special case of variables control charts. With the exception of Moving Average, Minitab's time-weighted control charts are weighted either by previous subgroup means or a target value. The advantage of using time-weighted control charts is the ability to detect small shifts from the target value.
A time-weighted control chart consists of:
|
|
Control Chart |
|
|
Quality Characteristic |
Time-Ordered |
Upper Control Limits (UCL) Center Line Lower Control Limits (LCL) |
Control charts evaluate the pattern of variation for stability through the use of tests for special causes. If you detect special cause variation, you should seek out the factors that contribute to this variation so that you can implement corrective measures.
Free online chart generators for statistical analysis:
Useful tools: