
Xbar Chart
Graphs - Xbar Chart


|
|
Xbar ChartGraphs - Xbar Chart |
|
 charts assess whether the process center
is in control.
The chart consists of the following:
charts assess whether the process center
is in control.
The chart consists of the following:
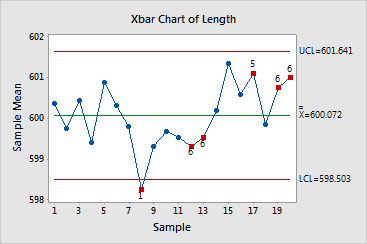
Minitab conducts up to eight tests for special causes
for the chart, which detect points beyond the control
limits and specific patterns in the data. Points that fail are marked
with a red symbol and the number of the failed test. Complete results
are available in the Session window. A failed point indicates that there
is a nonrandom pattern in the data that may be the result of special-cause variation.
These points should be investigated.
|
Note |
The process variation
must be in control before assessing the process center using an |
Example Output |
|
Interpretation |
|
The chart for the camshaft data can be summarized as
follows:
These test results indicate that the process average is unstable and the process is out of control, possibly due to the presence of special causes. Next, you would try to identify and correct the factors contributing to this special-cause variation. Until these causes are eliminated, the process cannot achieve a state of statistical control.
Free online chart generators for statistical analysis:
Useful tools:

