
Nonparametric Distribution Analysis – Right Censoring
Kaplan-Meier Graphs - Cumulative Failure Plot


|
|
Nonparametric Distribution Analysis
|
|
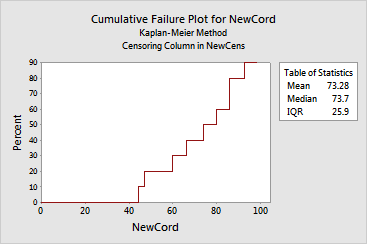
To describe product reliability in terms of when the product fails, the cumulative failure plot displays the cumulative percentage that an item fails by a particular time, t. The cumulative failure function represents 1 - survival function.
When you do not choose a distribution (when you choose to conduct a nonparametric analysis), the cumulative failure plot is a step function with steps at the exact failure times. The function is calculated using the Kaplan-Meier technique.
Example Output |
|
Interpretation |
|
For the iron cord data, the probability of the new iron cord failing by 73.7 hours is 0.5. In other words, a 50% chance exists that the iron cord will fail at or before 73.7 hours.
Free online chart generators for statistical analysis:
Useful tools:

