
Balanced MANOVA
Graphs - Residuals versus Fits


|
|
Balanced MANOVAGraphs - Residuals versus Fits |
|
This graph plots the residuals versus the fitted values. The residuals should be scattered randomly about zero. Use this plot to look for the following:
|
This pattern... |
Indicates... |
|
Fanning or uneven spreading of residuals across fitted values |
|
|
Curvilinear |
A missing higher-order term |
|
A point far away from zero |
An outlier |
Example Output |
|
Interpretation |
|
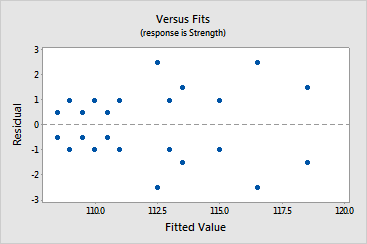
Based on the plot for strength, the residuals do no appear to be randomly scattered about zero. The residuals for the fitted strength values greater than 112.5 seem to have larger variances. To verify this analytically, the equal variance assumption was tested using Stat > ANOVA > Test for Equal Variances. The test results indicate insufficient evidence of unequal variance. The variation shown in the plot may be due to random fluctuations.
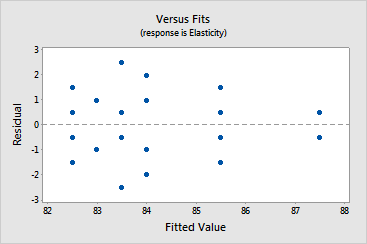
Based on the plot for elasticity, the residuals do no appear to be randomly scattered about zero. The residuals for the fitted elasticity values less than 84 have larger variances. To verify this analytically, the equal variance assumption was tested using Stat > ANOVA > Test for Equal Variances. The test results indicate that insufficient evidence of unequal variance. The variation shown in the plot may be due to random fluctuations.
Free online chart generators for statistical analysis:
Useful tools:

