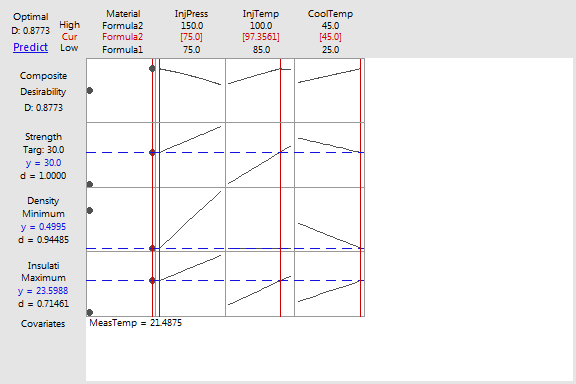
Response Optimizer
General Linear Model (GLM)

Graphs - Optimization Plot Interpretation


Look at the plot to see the variable settings that optimize the responses.

Response optimizer does not use the data in the worksheet. Instead, Minitab estimates the optimal variable values based on stored models. You must fit a model before you can use the response optimizer. If you want to optimize multiple responses, you must fit a model for each response separately. The optimal values are accurate only if all models represent the true relationships.

Example Output

Interpretation

For the insulation experiment:

·    Material: Formula2 is preferred more than Formula1 because it produces a strength closer to the target of 30.0, decreases the density, and increases the insulation. All of these properties are desired.

·    InjPress: Lowering the injection pressure is preferable because it moves strength closer to its target of 30.0, decreases density. However, the lower setting also reduces insulation, which is not desirable, but it is still within the acceptable range.

·    InjTemp: Increasing the injection temperature is preferable because it moves strength closer to its target and increases insulation. Injection temperature does not affect the density.

·    CoolTemp: Increasing the cooling temperature moves strength closer to the target of 30.0, decreases the density, and increases the insulation. All of these properties are desired.

For the insulation experiment, the individual desirabilities for the tire data are summarized below:

·    Strength has an individual desirability score of 1.0000 because the predicted response for elasticity of 30.0 is equal to the target of 30.

·    Density has a nearly perfect desirability score of 0.94485 because the predicted response of 0.4995 is very close to the target of 0.4351 and inside the acceptable range.

·    Insulation has the lowest desirability score of 0.71461 because the predicted response of 23.5988 is lower than the target of 27.7156 but still inside the acceptable range.

The composite desirability of 0.877291 is a very good score and indicates that all responses were close their ideal settings. The response optimization did not produce a perfect composite desirability score because both Density and Insulation did not achieve their ideal settings. However, they are all within the acceptable range.


Related Charting Tools

Free online chart generators for statistical analysis:

Useful tools: