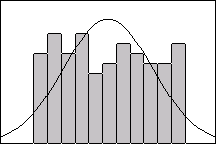
This distribution is flatter than normal and has a kurtosis value of -1.253.
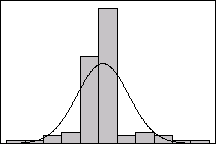
This distribution is more sharply peaked than normal and has a kurtosis value of 3.804.
kurtosis
Kurtosis refers to how sharply peaked a distribution is. A value for kurtosis is included with the graphical summary:
|
|
|
|
This distribution is flatter than normal and has a kurtosis value of -1.253. |
This distribution is more sharply peaked than normal and has a kurtosis value of 3.804. |
Free online chart generators for statistical analysis:
Useful tools: