
Binary Fitted Line Plot
Residual Plots - Residuals versus fits
![]()
![]()
![]()
|
|
Binary Fitted Line PlotResidual Plots - Residuals versus fits |
|
This graph plots the residuals versus the fitted values. When the data are in event/trial format and have repeated observations at the predictor values, the interpretation is similar to least squares regression. The residuals should be scattered randomly about zero. Use this plot to look for the following patterns:
|
This pattern... |
Indicates... |
|
Fanning or uneven spreading of residuals across fitted values |
Nonconstant variance or an inappropriate link function |
|
Curvilinear |
A missing higher-order term or an inappropriate link function |
|
A point far away from zero |
An outlier |
|
A point far away from the other points in the x-direction |
If the data do not have repeated observations at the predictor values, the plot is not informative.
Example Output |
|
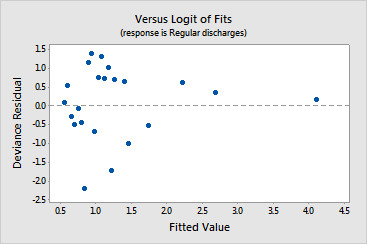
Interpretation |
|
For the health care center data, the observation with a logit of the fitted value greater than 4 is a point that is far away from the other points in the x-direction. This point is the observation for the patient who the center discharged after 75 days. The influence of this point can be large. You can fit the model with and without the point to examine how much influence the point has. You can also find out more information about this point so that you can decide whether the point belongs in a model that makes predictions about shorter lengths.
The data in the sample folder is not in event/trial format. See Change from binary response format to event/trial format to learn how to produce this plot.