
Examples of linear, quadratic, and cubic fitted lines
Minitab can fit three types of equations (lines) to your data:
|
|
Y = b0 + b1 X |
|
|
Y = b0 + b1X + b2X |
|
|
Y = b0 + b1X + b2X |
In each equation, Y is the value of the response variable, X is the value of the predictor variable, and b0, b1, b2, and b3 are constants.
Below are plots of data fitted with each type of equation.
Linear
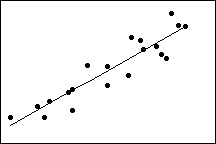
An example of data best fit with a linear equation. (The equation for the line shown is Y = -10.73 + 0.57X)
Quadratic
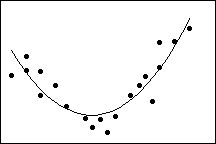
An example of data best fit with a quadratic equation. (The equation
for the line shown is Y = 51.03 - 2.82X + 0.05X )
)
Cubic
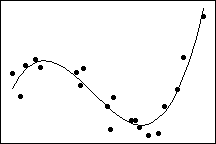
An example of data best fit with a cubic equation. (The equation for
the line shown is Y = - 0.99 + 8.01X - 3.08X + 0.26X ).
).
Free online chart generators for statistical analysis:
Useful tools: