
Overlaid Contour Plot
Poisson Regression
Graphs - Overlaid Contour Plot


|
|
Overlaid Contour Plot
|
|
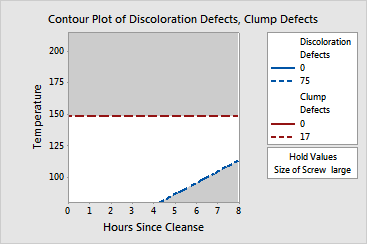
Look at the overlaid contour plot and find the white area, which is the feasible region. The feasible region is the area formed by the two continuous variables, given the hold values of any other variables, such that the mean values for each response are between their respective contours.
Because only a pair of continuous variables can be displayed on each overlaid contour plot, and any additional variables are held at a fixed level, a single contour plot may not provide a complete picture of the feasible region. You might consider creating overlaid contour plots for all possible pairs of continuous variables, and changing the hold values of the additional variables.
Example Output |
|
Interpretation |
|
For the resin defect data, the white area is the region formed by Hours Since Cleanse and Temperature, given the size of the screw is large, such that the mean values for the two responses are between their respective contours. Therefore, any values for Hours Since Cleanse and Temperature that fall in this region should produce a product with a small enough mean number of defects. The more time since workers clean the equipment, the narrower the range of temperatures that produce acceptable numbers of defects. For example, possible combination of variable settings include:
Free online chart generators for statistical analysis:
Useful tools:

