
Nonlinear Regression
Graphs - Residuals versus the Variables


|
|
Nonlinear RegressionGraphs - Residuals versus the Variables |
|
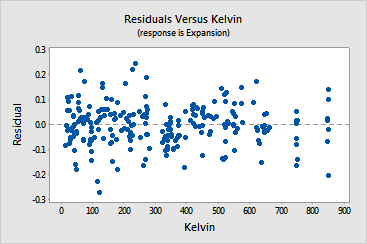
This graph plots the residuals versus another variable. The residuals should fluctuate in a random pattern around the center line. If the variable is already included in the model, use the plot to determine if you should modify the expectation function. If the variable is not already included in the model, use the plot to determine if the variable is influencing the response in a systematic way. If so, consider adding this variable into the model.
Use this plot to look for the following:
|
This pattern... |
Indicates... |
|
Pattern in residuals |
The variable is influencing the response in a systematic way |
|
Curvature in the points or other systematic difference from zero |
An incorrectly specified expectation function |
Example Output |
|
Interpretation |
|
For the copper expansion data, the predictor Kelvin is plotted versus the residuals. The residuals appear to be scattered randomly about zero which suggests the model accurately includes Kelvin.
Free online chart generators for statistical analysis:
Useful tools:

