
Partial Least Squares
Component Evaluation - Calculated X Plot
![]()
![]()
![]()
|
|
Partial Least SquaresComponent Evaluation - Calculated X Plot |
|
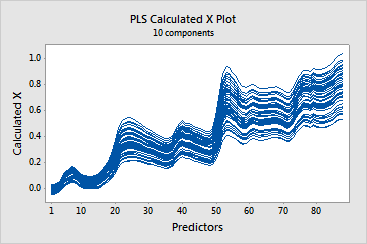
The calculated X plot is a line plot of the x-calculated values versus the predictors. Each line represents an observation and has as many points as it has predictors. Use this plot to identify observations or predictors that the model describes poorly. This plot is most useful with predictors that are on the same scale.
This plot complements the x-residual plot. The sum of both plots results in a plot of the original predictor values. A predictor with x-calculated values that are much smaller or larger than the original x-values is not well described by the model.
Example Output |
|
Interpretation |
|
In this example, most of the x-calculated values are very close to the original predictor values, indicating that the model describes most of the variance in the predictors.
| Minitab help | Stat | Graph | SixSigma | DOE | Glossary | Reliability | SPC,MSA,CPK | ||
|
|||||||||