
One-Way ANOVA
Power and Sample Size
Graphs - Power


|
|
One-Way ANOVAPower and Sample Size |
|
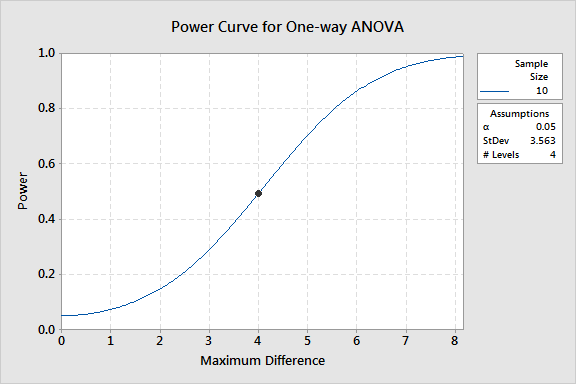
Use the power curve to help you choose the appropriate sample size or power for your test. This power curve plots the power of the test versus the maximum difference between level means.
If you provide the maximum difference that you want to be able to detect and the size of your samples, Minitab will calculate the power of the test.
Example Output |
|
Interpretation |
|
For the paint data, the power curve represents every combination of power and maximum difference based on a sample of size 10. The symbol on the power curve represents the calculated power of 0.492148 for a maximum difference of 4.
Free online chart generators for statistical analysis:
Useful tools:

