
ARIMA
Graphs - Residuals versus Fits


|
|
ARIMAGraphs - Residuals versus Fits |
|
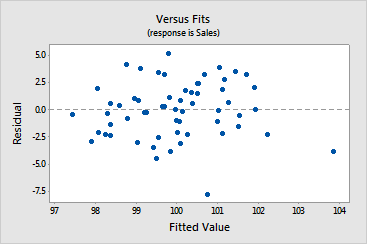
This graph plots the residuals versus the fitted values. The residuals should be scattered randomly about zero. Use this plot to look for the following:
|
This pattern... |
Indicates... |
|
Fanning or uneven spreading of residuals across fitted values |
|
|
Curvilinear |
A missing higher-order term |
|
A point far away from zero |
An outlier |
Example Output |
|
Interpretation |
|
Based on this plot, the residuals appear to be randomly scattered about zero, except for the outlier in the bottom half of the plot. No evidence of nonconstant variance or missing terms exists.
Free online chart generators for statistical analysis:
Useful tools:

