
Autocorrelation
Graphs - Autocorrelation Function


|
|
AutocorrelationGraphs - Autocorrelation Function |
|
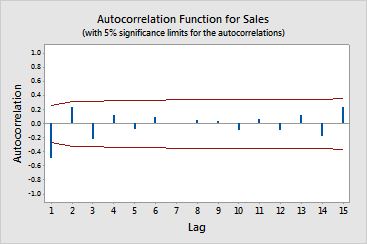
Minitab generates the autocorrelation function (ACF) with 95% confidence limits for the correlations (red).
Example Output |
|
Interpretation |
|
The ACF for the sales data shows a large negative significant spike at lag 1 (this means that the autocorrelation of the successive pairs of observations within 1 time period is not within sampling error of zero). All of the other autocorrelations (for lags 2 to 15) are within the 95% confidence limits. This pattern is typical to a moving average (MA) process of order one.
Free online chart generators for statistical analysis:
Useful tools:

