
Winters' Method (Additive)
Graphs - Predicted versus Actual


|
|
Winters' Method (Additive)Graphs - Predicted versus Actual |
|
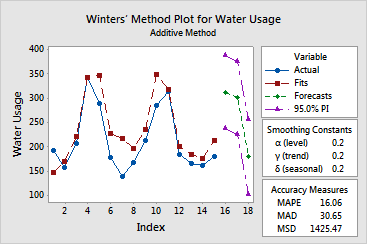
The Winters' additive procedure draws a graph containing the observations, predicted values, and forecasts, versus time.
The Winters' additive procedure also displays, along with the graph, the smoothing constants and three measures to help you determine the accuracy of the fitted values: MAPE, MAD, and MSD.
Example Output |
|
Interpretation |
|
For the water usage data, you should fit other models and compare the accuracy measures before deciding on a final model.
Free online chart generators for statistical analysis:
Useful tools:

