
Winters' Method (Additive)
Graphs - Residuals versus Fits


|
|
Winters' Method (Additive)Graphs - Residuals versus Fits |
|
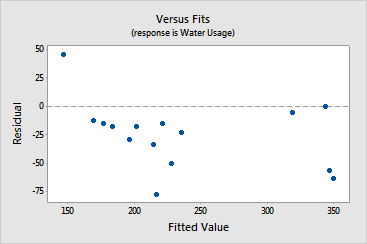
This graph plots the residuals versus the fitted values. The residuals should be scattered randomly about zero. Use this plot to look for the following:
|
This pattern... |
Indicates... |
|
Fanning or uneven spreading of residuals across fitted values |
|
|
Curvilinear |
A missing higher-order term |
|
A point far away from zero |
An outlier |
Example Output |
|
Interpretation |
|
Based on this plot, the residuals do not appear to be randomly scattered about zero. Evidence of nonconstant variance exists.
Free online chart generators for statistical analysis:
Useful tools:

