main topic interpreting results session command see also
The data used in the example are highly right skewed, and consist of 50 subgroups each of size 5. If you like, you can look at the spread of the data both before and after the transformation using Graph > Histogram.
1 Open the worksheet BOXCOX.MTW.
2 Choose Stat > Control Charts > Box-Cox Transformation.
3 Choose All observations for a chart are in one column, then enter Skewed.
4 In Subgroup sizes, enter 5.
5 Click Options. Under Store transformed data in, enterC2. Click OK in each dialog box.
Graph window output
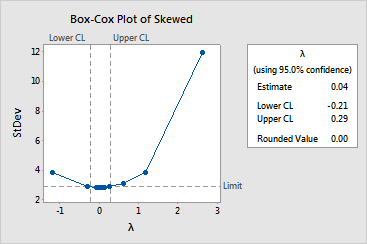
The Lambda table contains an estimate of lambda (0.04) and the rounded value (0.00), which is the value used in the transformation. The Lambda table also includes the upper CI (0.29) and lower CI (- 0.21), which are marked on the graph by vertical lines.
Although the best estimate of lambda is a very small number, in any practical situation you want a lambda value that corresponds to an understandable transformation, such as the square root (a lambda of 0.5) or the natural log (a lambda of 0). In this example, 0 is a reasonable choice because it falls within the 95% confidence interval. Therefore, the natural log transformation may be preferred to the transformation defined by the best estimate of lambda.
The 95% confidence interval includes all lambda values which have a standard deviation less than or equal to the horizontal line. Therefore, any lambda value which has a standard deviation close to the dashed line is also a reasonable value to use for the transformation. In this example, this corresponds to an interval of - 0.21 to 0.29.