
Gage R&R Study (Crossed)
ANOVA Method
Graphs - By Part


|
|
Gage R&R Study (Crossed)ANOVA Method |
|
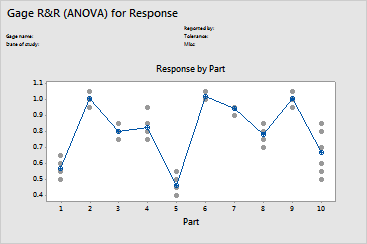
The By Part graph shows all of the measurements taken in the study, arranged by part. The measurements are represented by dots; the means are represented by the circle-cross symbol. The blue line connects the average measurements for each part.
Ideally,
|
Note |
If the number of observations per level is greater than 9, a boxplot is displayed. |
Example Output |
|
Interpretation |
|
For the parts data, the measurements for part 10 vary quite a bit. This variation may be due to the system's (operator and/or gage) inability to consistently measure that part. The averages also vary significantly. This should occur because the parts chosen for the study should represent the entire range of possible parts.
Free online chart generators for statistical analysis:
Useful tools:

