
Gage R&R Study (Crossed)
ANOVA Method
Graphs - By Operator


|
|
Gage R&R Study (Crossed)ANOVA Method |
|
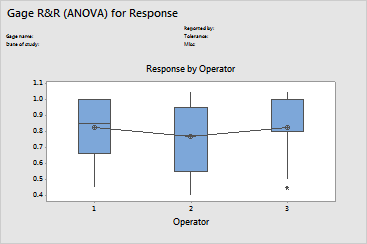
The By Operator graph shows all of the measurements taken in the study, arranged by operator. The measurements are represented by dots; the means by the circle-cross symbol. The line connects the average measurements for each operator.
Ideally,
|
Note |
If the number of observations per level is greater than 9, a boxplot is displayed. |
Example Output |
|
Interpretation |
|
For the parts data, this seems to be the case. There will always be some variation, but it appears the operators are measuring consistently. To be sure, check the Operator*Part interaction plot when determining whether operators are measuring similarly.
Free online chart generators for statistical analysis:
Useful tools:

