
Capability Analysis - Normal
Graphs - Overall Capability
![]()
![]()
![]()
|
|
Capability Analysis - NormalGraphs - Overall Capability |
|
The overall capability indices are associated with the overall sample standard deviation.
The industry guidelines determine whether the process is capable. A generally accepted minimum value for the indices is 1.33.
These indices depict how the process is actually performing relative to the specification limits. The capability indices consist of the following:
Use PPL and PPU when you have a single-sided specification limit. For example, if you want a cable to meet a minimum strength, you might compare the process to the lower specification limit.
Ppk considers the location of the process mean, while Pp does not. If Pp and Ppk are approximately equal, then the process is centered between specification limits. If Pp is greater than Ppk, the process is not centered.
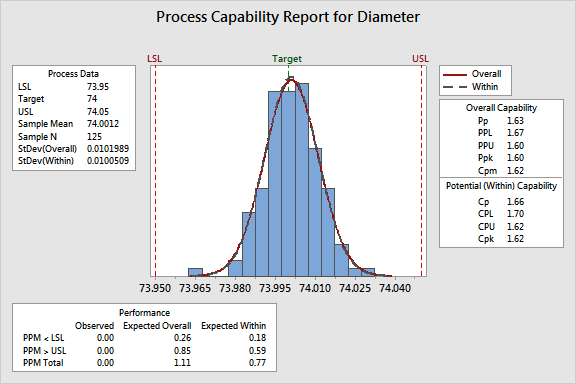
A substantial difference between the overall and within capability indices may indicate that the process is out of control, or the sources of variation are not estimated by the within-subgroup component of variation. In this example, the within and overall capability indices are very close to each other.
Example Output |
|
Interpretation |
|
For the piston data, Pp is 1.63, which indicates that the specification spread is 1.63 times greater than the 6-s spread in the process.
Pp (1.63), Ppk (1.60), and Cpm (1.62) are very close to one another, indicating that the process is centered on target. All three capability indices are greater than 1.33, which traditionally is the value used for determining capability. Thus, the process is centered on target and is capable of producing pistons that conform to specifications.