
General MANOVA
Graphs - Residuals versus the Variables
![]()
![]()
![]()
|
|
General MANOVAGraphs - Residuals versus the Variables |
|
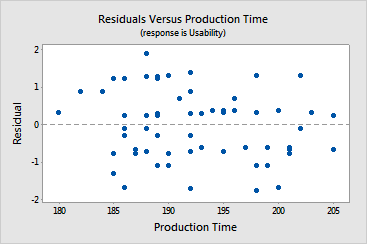
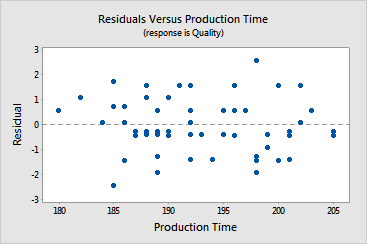
Each of the residuals versus the variables plots shows the residuals plotted against another variable, such as location or temperature. This plot can help you determine if another variable is influencing the response data in a systematic way. If the variable does not affect the response, the points at each level of the factor should be randomly scattered around zero. Any noticeable pattern should be investigated further.
Example Output |
|
Interpretation |
|
For the door lock data, production time data was collected in addition to the other information. You want to see if production time is a covariate that affects fiber usability and quality. The plots of the residuals by production time for usability and quality do not appear to reveal a pattern, suggesting that production time does not affect fiber usability or quality in a systematic way.