
General MANOVA
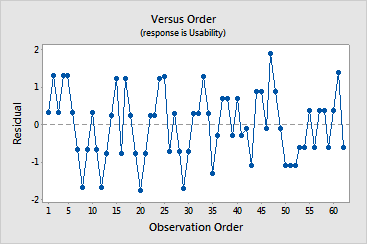
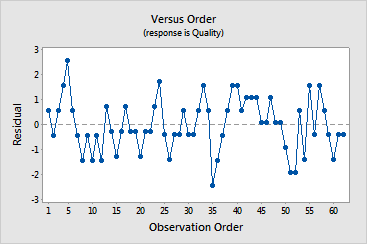
Graphs - Residuals versus Order
![]()
![]()
![]()
|
|
General MANOVAGraphs - Residuals versus Order |
|
This graph shows the residuals plotted in order of the corresponding observations in the worksheet. Thus, if the observations in the worksheet are organized according to the time they were collected, for instance, you can use this plot to look for any systematic effects of time or collection order on the response variable.
Example Output |
|
Interpretation |
|
For the door lock data, no systematic effect of order on the data exists for usability or quality.