
Contour Plot
General Linear Model (GLM)
Two Variables
![]()
![]()
![]()
|
|
Contour Plot
|
|
Use a contour plot to help you visualize the response surface. Contour plots are useful for determining desirable response values and operating conditions.
A contour plot shows how a response variable relates to two continuous variables based on a model equation. That is, the contour plot represents, in two dimensions, the functional relationship between the response and the variables. Points that have the same response are connected to produce contour lines of constant responses.
Contour plot does not use the data in the worksheet. Instead, Minitab estimates the contours based on a stored model. You must fit a model with two or more continuous variables before you can generate a contour plot. Contour plots are accurate only if the model represents the true relationships.
Example Output |
|
Interpretation |
|
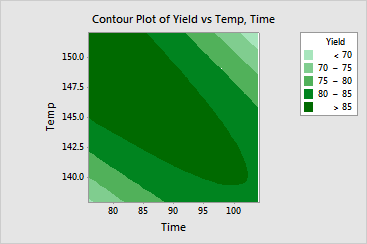
For the catalytic reaction data, the contour plot shows the following:
Observe that yield increases as you move from the lower right to the
upper left corner of the plot. That is, yield increases as you simultaneously
reduce Time and increase Temperature. This plot suggests that you can
maximize Yield at a temperature of slightly more than 150
The contours suggest that the response surface is a rising ridge.