
Equivalence Test with Paired Data
Graphs - Boxplot
![]()
![]()
![]()
|
|
Equivalence Test with Paired DataGraphs - Boxplot |
|
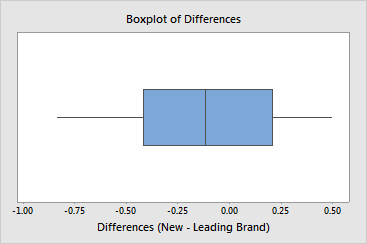
The boxplot conveys the following information about the distribution of the differences:
Example Output |
|
Interpretation |
|
The boxplot of the difference indicates that there are no outliers. The distribution appears to be symmetrical, with little or no skew.