
Gage Linearity and Bias Study
Graphs - Gage Bias
![]()
![]()
![]()
|
|
Gage Linearity and Bias StudyGraphs - Gage Bias |
|
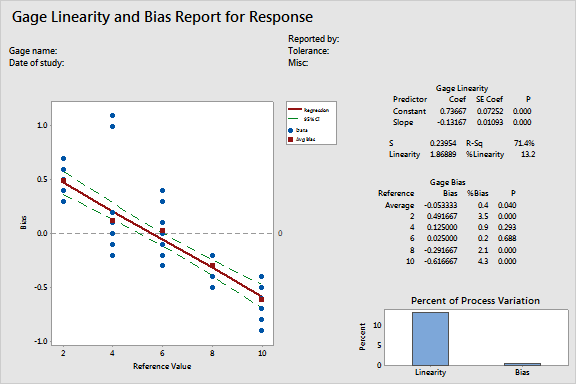
The gage bias table consists of:
Ideally, the bias will be close to zero relative to the reference part measurements.
For a gage that measures accurately, the %bias will be small as well.
Example Output |
|
Interpretation |
|
For the parts data, the average bias (-0.053333) and %bias (0.4) indicate that there is some variability due to bias. The p-value is 0.040. Because the p-value is less than the chosen level of significance (a-level), typically set at 0.05, you can reject the null hypothesis that bias equals 0.