
General MANOVA
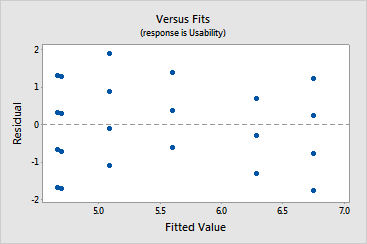
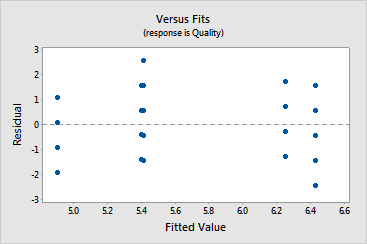
Graphs - Residuals versus Fits
![]()
![]()
![]()
|
|
General MANOVAGraphs - Residuals versus Fits |
|
This graph plots the residuals versus the fitted values. The residuals should be scattered randomly about zero. There should be no special features or patterns in the residuals, such as:
Example Output |
|
Interpretation |
|
For the door lock data, the residuals for the fitted usability and quality values seem scattered randomly about zero.