overviews how to examples data see also
Graph > Bar Chart
Use to compare some measure of data categories. Each bar can represent a count of a category, a function of a category (such as the mean, sum, or standard deviation), or summary values from a table.
|
Note |
If you want to examine the shape and spread of continuous data, use Graph > Histogram. |
Bars represent
Counts of unique values: Choose if you have one or more columns of categorical data and you want to chart the frequency of each category.
A function of a variable: Choose if you have one or more columns of quantitative data and you want to chart a function of the measurement data, such as the mean.
Values from a table: Choose if you have one or more columns of summary data and you want to chart the summary value for each category.
Graph gallery
The graph gallery that appears depends on your choice for Bars represent:
Choose one of the following options:
Counts of unique values <back to top> |
|||||||||||||||||||||||||||
|
Data
|
|
|
| ||||||||||||||||||||||||
|
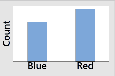
Counts for Color |
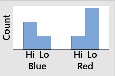
Counts for Color by Density |
||||||||||||||||||||||||||
Function of a variable <back to top> |
|||||||||||||||||||||||||||
|
|
One Y |
|
| ||||||||||||||||||||||||
|
Data
|
|
|
| ||||||||||||||||||||||||
|
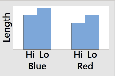
Mean of Length by Color |
Mean of Length by Color and Density |
||||||||||||||||||||||||||
|
|
Multiple Y's |
|
| ||||||||||||||||||||||||
|
Data
|
|
|
| ||||||||||||||||||||||||
|
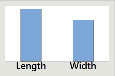
Mean of Length and Width |
Mean of Length and Width by Density |
||||||||||||||||||||||||||
Values from a table <back to top> |
|||||||||||||||||||||||||||
|
|
One column of values |
| |||||||||||||||||||||||||
|
Data
|
|
|
| ||||||||||||||||||||||||
|
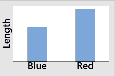
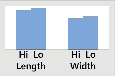
Length by Color |
|
| |||||||||||||||||||||||||
|
Data
|
|
|
| ||||||||||||||||||||||||
|
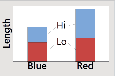
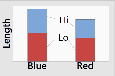
Length by Color and Density |
| ||||||||||||||||||||||||||
|
|
Two-way table |
|
| ||||||||||||||||||||||||
|
Data
|
|
|
| ||||||||||||||||||||||||
|
Length by Color and Density |
| ||||||||||||||||||||||||||